What is photogrammetry? Definition, history and uses
Photogrammetry definition: measuring from overlapping photographs to make maps and 3D models. Where it came from, the one idea underneath it, and what comes out of it.
Published · 9 min read · By Malya, the makers of Clarity
Photogrammetry is measurement from photographs. Take two pictures of the same thing from two places and every point on it shifts between them; the closer the point, the bigger the shift. Measure the shifts and you can work out where every point sits in space. Do it with a few hundred overlapping pictures and a computer, and you have a three-dimensional model of a whole site, in real coordinates, that you can measure as if you were standing on it with a tape.
The word is a hundred and fifty years old and the mathematics older, but the method as it is used today, from drones, by survey crews and site engineers, is barely fifteen. What follows is the idea underneath it, where it came from, what a survey comes back as, and why it has replaced so much of what came before.
The one idea: a point seen from two places
Hold a finger in front of your face and close one eye, then the other. The finger jumps against the background. That jump is parallax, and your brain turns it into depth without being asked. Photogrammetry does the same with a camera: two photographs taken from two positions are a pair of eyes, and the shift of a point between them says how far away it is.
One more step turns the shift into a measurement. A camera lens is a known geometry: light from a point on the ground passes through the lens centre and lands on one pixel. Run that line backwards from the pixel through the lens and it points at the ground. From one photograph you only know the point is somewhere on that line; from two photographs you have two lines, and the point is where they cross.
- base / height
- 0.28
- position error
- ≈ 3 cm
- height error
- ≈ 11 cm
That is the whole of it, in principle. Everything else in photogrammetry is bookkeeping at scale: finding tens of thousands of points that appear in several pictures, working out where each camera was and which way it pointed (because a drone's own record is only roughly right), fitting all of it together so the lines cross as cleanly as possible, and then filling in the ground between the points. The next page walks through those steps with the real pictures.
- Measures
- Position, length, area, height, volume, shape; and colour, which a laser cannot
- Needs
- Overlapping photographs, a surface with some texture, and something to set the scale
- Gives
- A point cloud, a textured 3D mesh, an orthomosaic, surface and terrain models
- Accuracy
- Centimetres from a drone with ground control; sub-millimetre at close range with scale bars
Where it came from
Measuring from pictures is older than the camera: surveyors drew perspective views with a camera lucida and worked positions back from them in the 1840s. The photograph made the drawing exact, and the discipline grew up alongside it.
1850s
Aimé Laussedat maps from photographs
A French military engineer used ground photographs of Paris and its surroundings to make plans by intersection, the first metric use of the camera. He is usually called the father of photogrammetry.
1867
The word is coined
The term appeared in December 1867 in the weekly of the Berlin architects' society, in an article on measuring buildings from photographs; Albrecht Meydenbauer, who recorded Prussia's monuments that way for decades, was named as its author in 1892.
1901
The stereocomparator
Carl Pulfrich's instrument let an operator measure parallax between two glass plates under magnification, and made stereo measurement precise and routine.
1910s–1930s
Into the air
Aerial photography from the First World War, then stereoplotters: optical-mechanical machines that projected two aerial photographs so an operator could trace contours in three dimensions. The International Society for Photogrammetry was founded in Vienna in 1910.
1950s–1970s
The analytical era
Computers took over the geometry. The analytical plotter (Uki Helava, 1957) measured on the photographs and let the computer do the projection, and the bundle adjustment, the single calculation that fits every photograph at once, became standard.
1980s–1990s
Digital photogrammetry
Scanned and then digital photographs, with software matching the images automatically; elevation models and orthoimages from satellites and aircraft became products you could order.
2006
Structure from motion
Computer-vision research showed that an unordered pile of ordinary photographs, with no known camera positions, could be turned into cameras and a point cloud automatically. The pile could be tourists' photos of a monument.
2010s
Drones
A small drone with a consumer camera, an automatic flight plan and structure-from-motion software put a survey that had needed an aircraft and a specialist within reach of a site crew. This is the photogrammetry most people now mean.
2020s
RTK positioning and cloud processing
Drones that know where each photograph was taken to a few centimetres, processing that runs on a server rather than a workstation, and the model delivered in a browser to everyone on the job.
What comes out of it
A photogrammetry survey is not one file but a family of them, each answering a different question. They are all made from the same solution, so they agree with one another to the pixel.
- Point cloudMillions of points in space, each with a colour. The rawest product and the one that laser scanners also make, so the two can be compared and merged.
- Textured meshThe points joined into a surface of triangles with the photographs laid over it. The model you orbit and show people; the surface heights are read from.
- OrthomosaicThe photographs re-projected straight down at one scale and blended into a single image in map coordinates. Measure positions, lengths and areas on it; not heights.
- Elevation modelsA grid of heights of the surface (everything the camera saw) and of the terrain (the ground alone). Volumes, contours, cut and fill and drainage come from these.
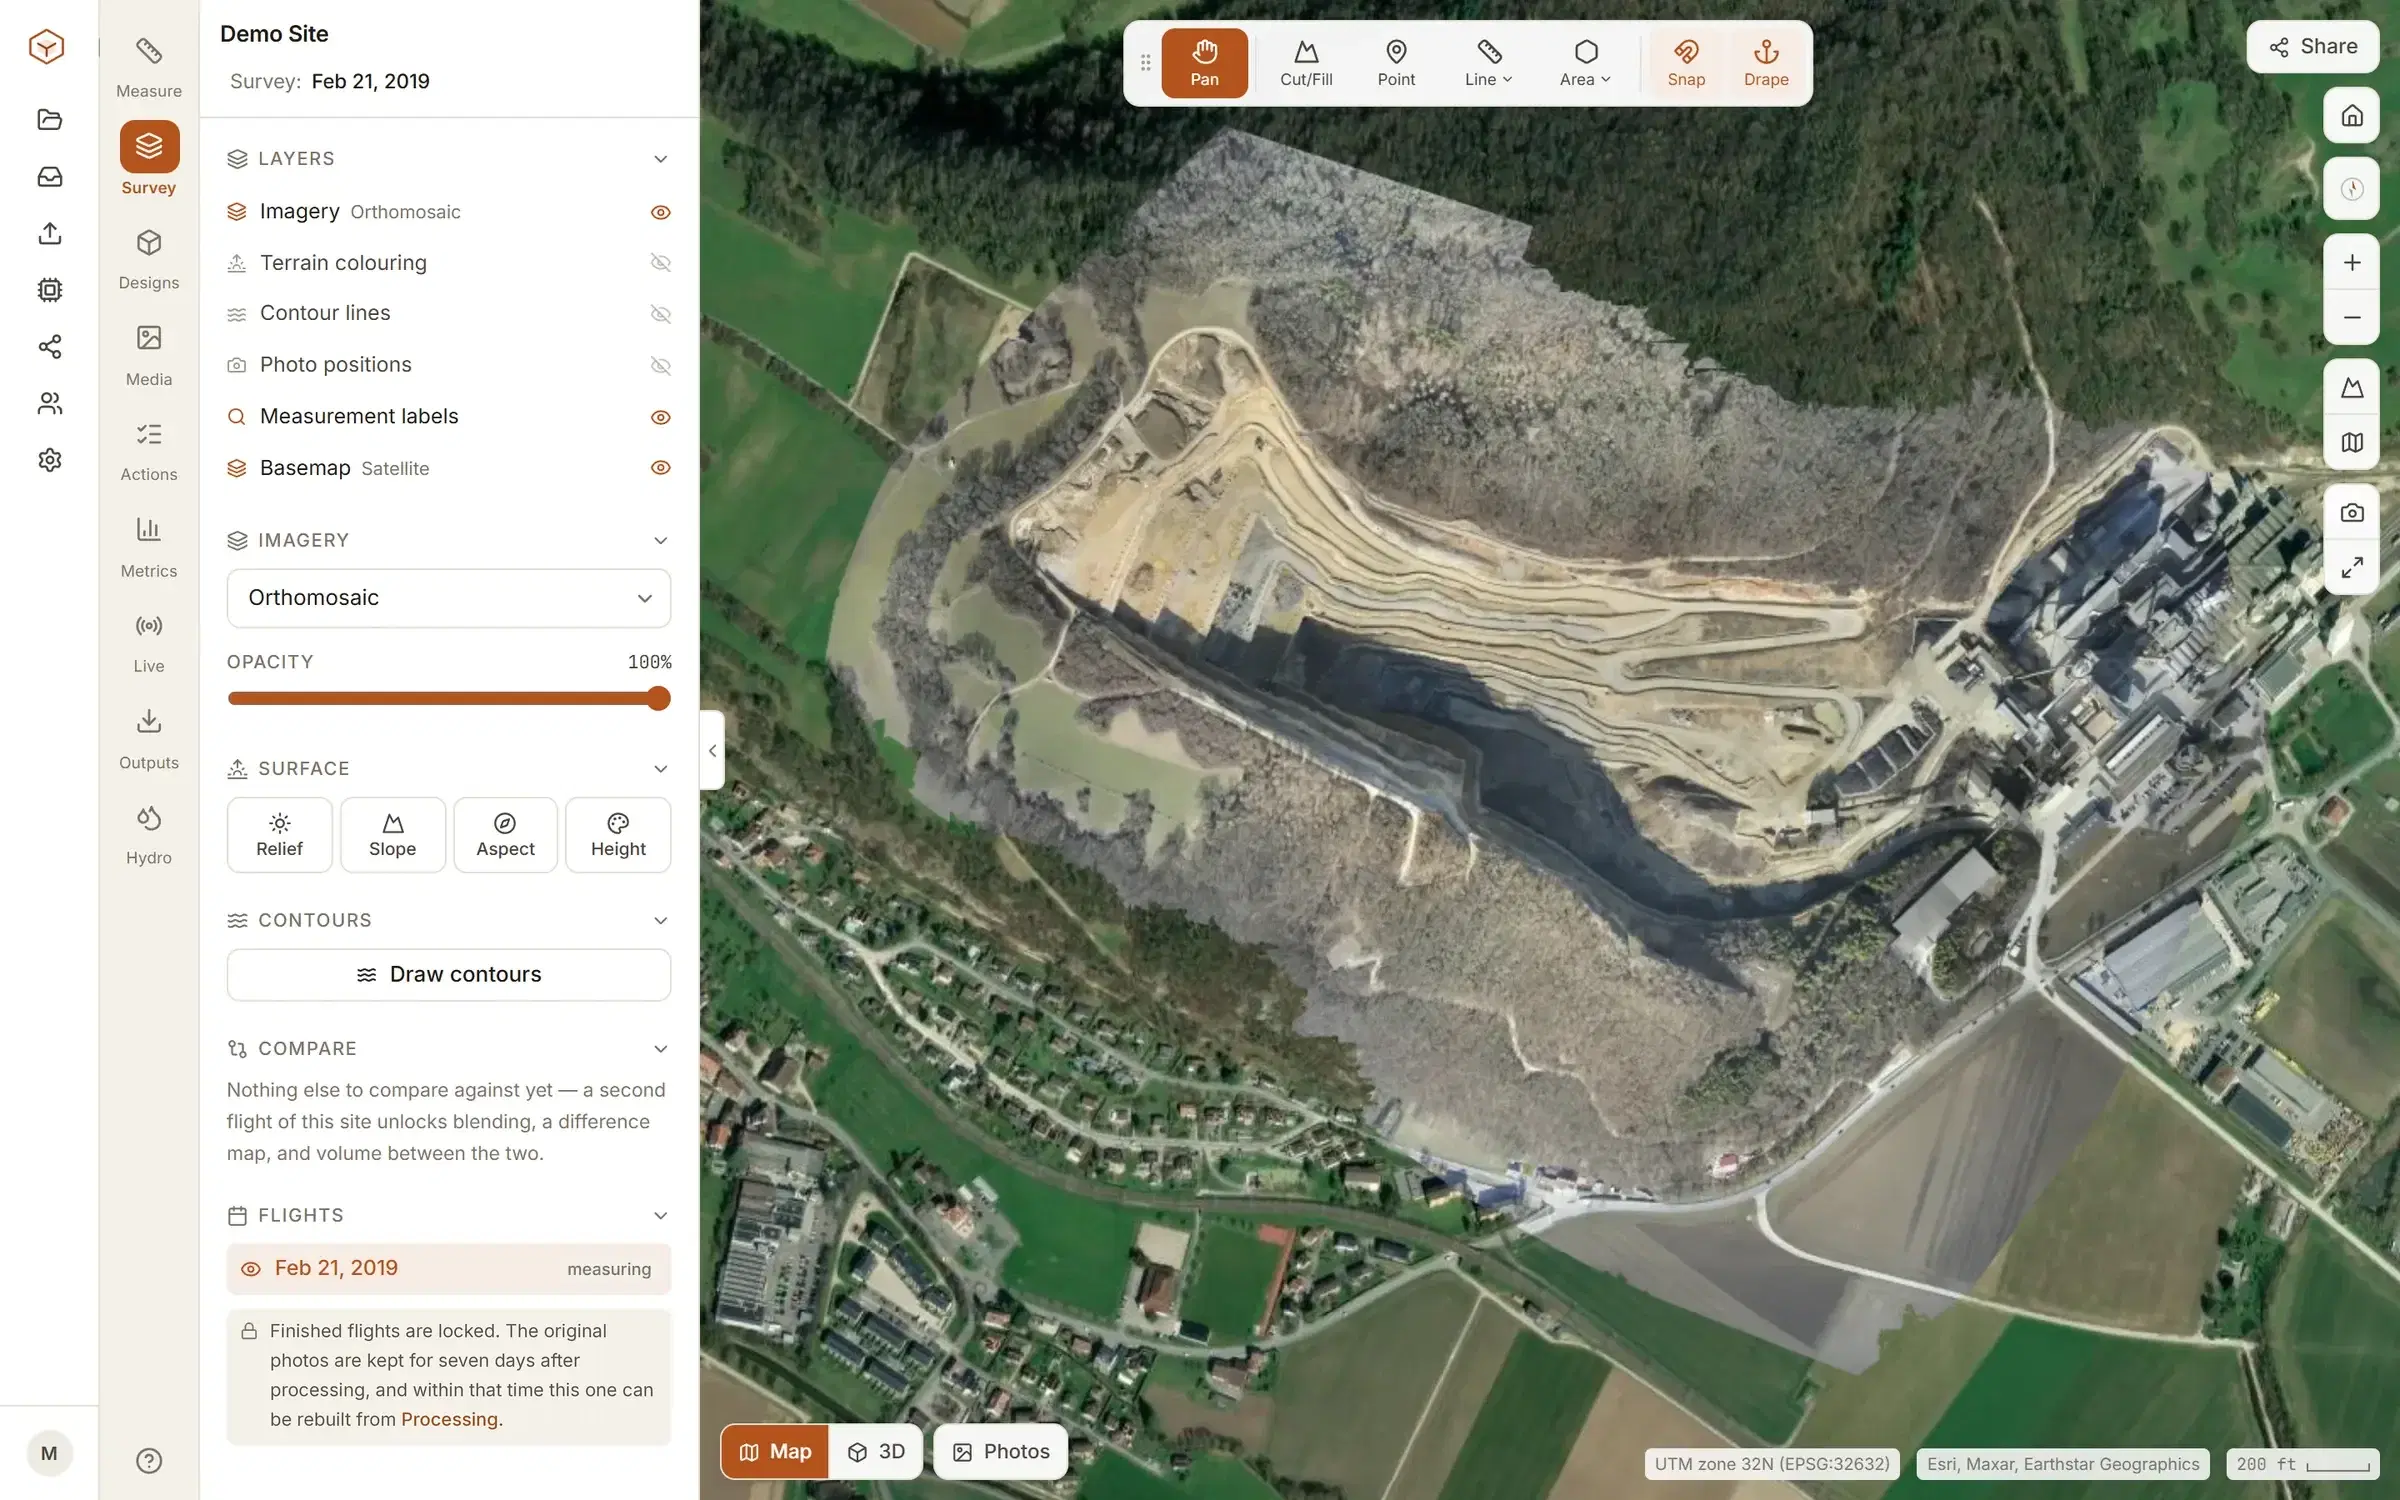
Which file to measure on is the most common question, and the most common mistake. The guide to the three files answers it in detail; the short version is that anything with height is measured on an elevation model, and anything flat on the orthomosaic.
The kinds of photogrammetry
The idea is one; the practice splits by how far the camera is from the subject and where it stands. Aerial photogrammetry, from drones and aircraft, maps ground. Close-range photogrammetry, from the ground, models objects, faces of buildings and machinery, with scale bars instead of GNSS. Satellite photogrammetry makes terrain models of whole regions from stereo imagery. Underwater photogrammetry models wrecks and reefs. Each has its own equipment and its own failure modes; the page on the types sets them side by side.
Why it took over
A total station measures one point at a time, exactly. A laser scanner measures millions, from one spot. A drone photograph measures nothing; it only records. But a few hundred photographs, processed, give millions of measured points over a whole site from an instrument that costs less than the truck it rides in, with the colour of everything built in, flown in half an hour by the person who needs the answer. For the jobs where centimetres are enough and the site is open to the sky, which is most of earthworks, mining, construction and agriculture, that trade has proved hard to beat.
It is not the right tool for everything. Under trees, on water, on blank or shiny surfaces and where millimetres matter, other instruments win, and the pages on LiDAR, scanning and the method’s limitations say exactly where.
Sources
Questions people ask
What is photogrammetry, in one sentence?
Photogrammetry is the science of making measurements from photographs: by finding the same points in two or more pictures taken from different places, it works out where those points are in three dimensions, and from many such points builds a model you can measure.
Do I need a drone?
Not for photogrammetry in general: a phone and a scale bar will model an object on a table. For a site, a quarry or a building, a drone is the practical way to get the hundreds of overlapping photographs from above that a survey needs.
What does a photogrammetry survey give me?
A point cloud, a textured 3D mesh, an orthomosaic (a photo-map at constant scale) and elevation models of the surface and the terrain, all in real-world coordinates, plus a report of how well it fitted the control.
See it on a real site.
Explore is free, with no card and no expiry: a real quarry, already flown and processed, with every measuring tool on it.
Read next
- How photogrammetry works: structure from motion, step by stepFeatures, matches, bundle adjustment, dense cloud, mesh, orthomosaic: each step, with what can go wrong at it.
- Photogrammetry 101: how to make a 3D model from photosPlan, capture, control, process, check, deliver: the whole job, with the numbers to plan it by.
- Types of photogrammetry: aerial, close-range, satellite and moreAerial, close-range, satellite, underwater; stereo and structure from motion; which fits which job.
- All resources