Every measurement, with the ground under it.
Where a drone survey has a terrain model, every tool reads it, so a slope distance is a slope distance and a volume is a volume.
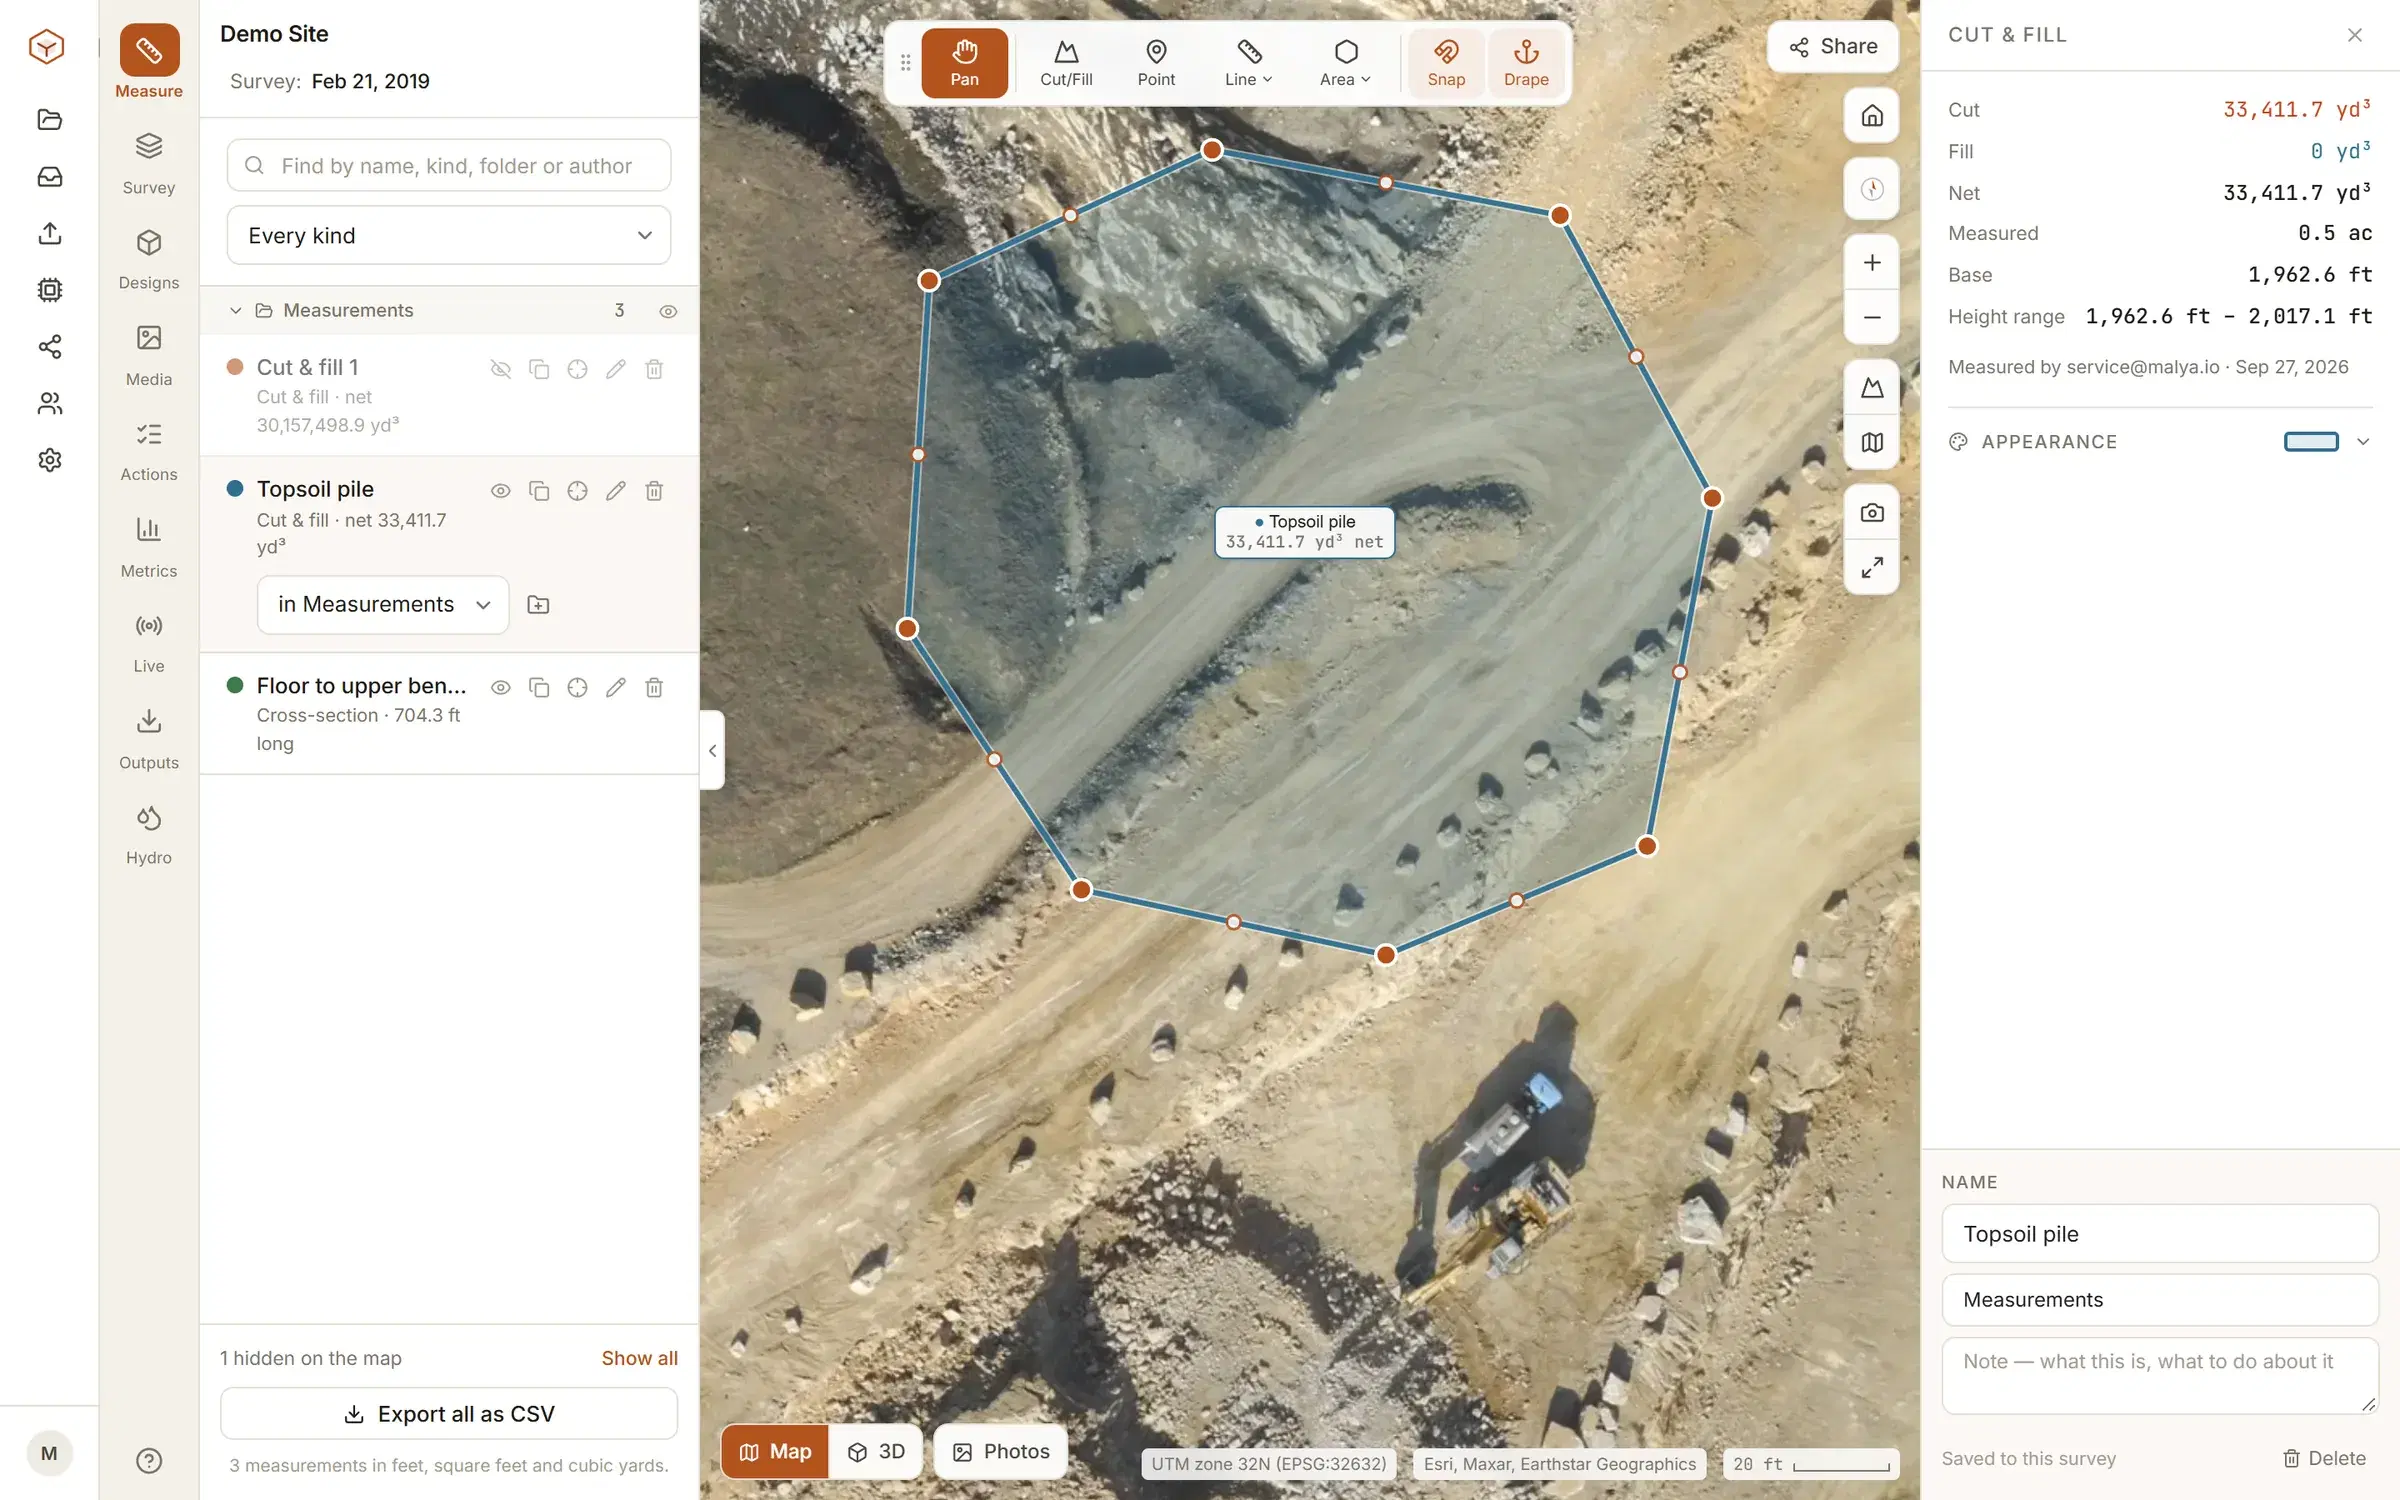
Volumes and cut and fill.
Draw a boundary and pick what the ground is measured against. The base you choose is shown with the result, so the number can be argued with rather than believed.
Swell and shrink factors, a density for tonnage, and a deadband so survey noise is not counted as movement. If part of what you drew had no ground under it, the result says so.
In more detail: stockpile volumes and how the base is chosen, and cut and fill against a design surface. Measuring one flight against another is how progress is tracked from month to month.
- Lowest, highest or mean point
- inside the boundary, for a pile or a pit on flat ground
- A best-fit plane
- through what you drew, for a pile on a slope
- A fixed level
- or design levels you type in at each corner
- The design surface
- your engineer exported, as LandXML or DXF
- Another flight
- of the same site, for what moved between the two
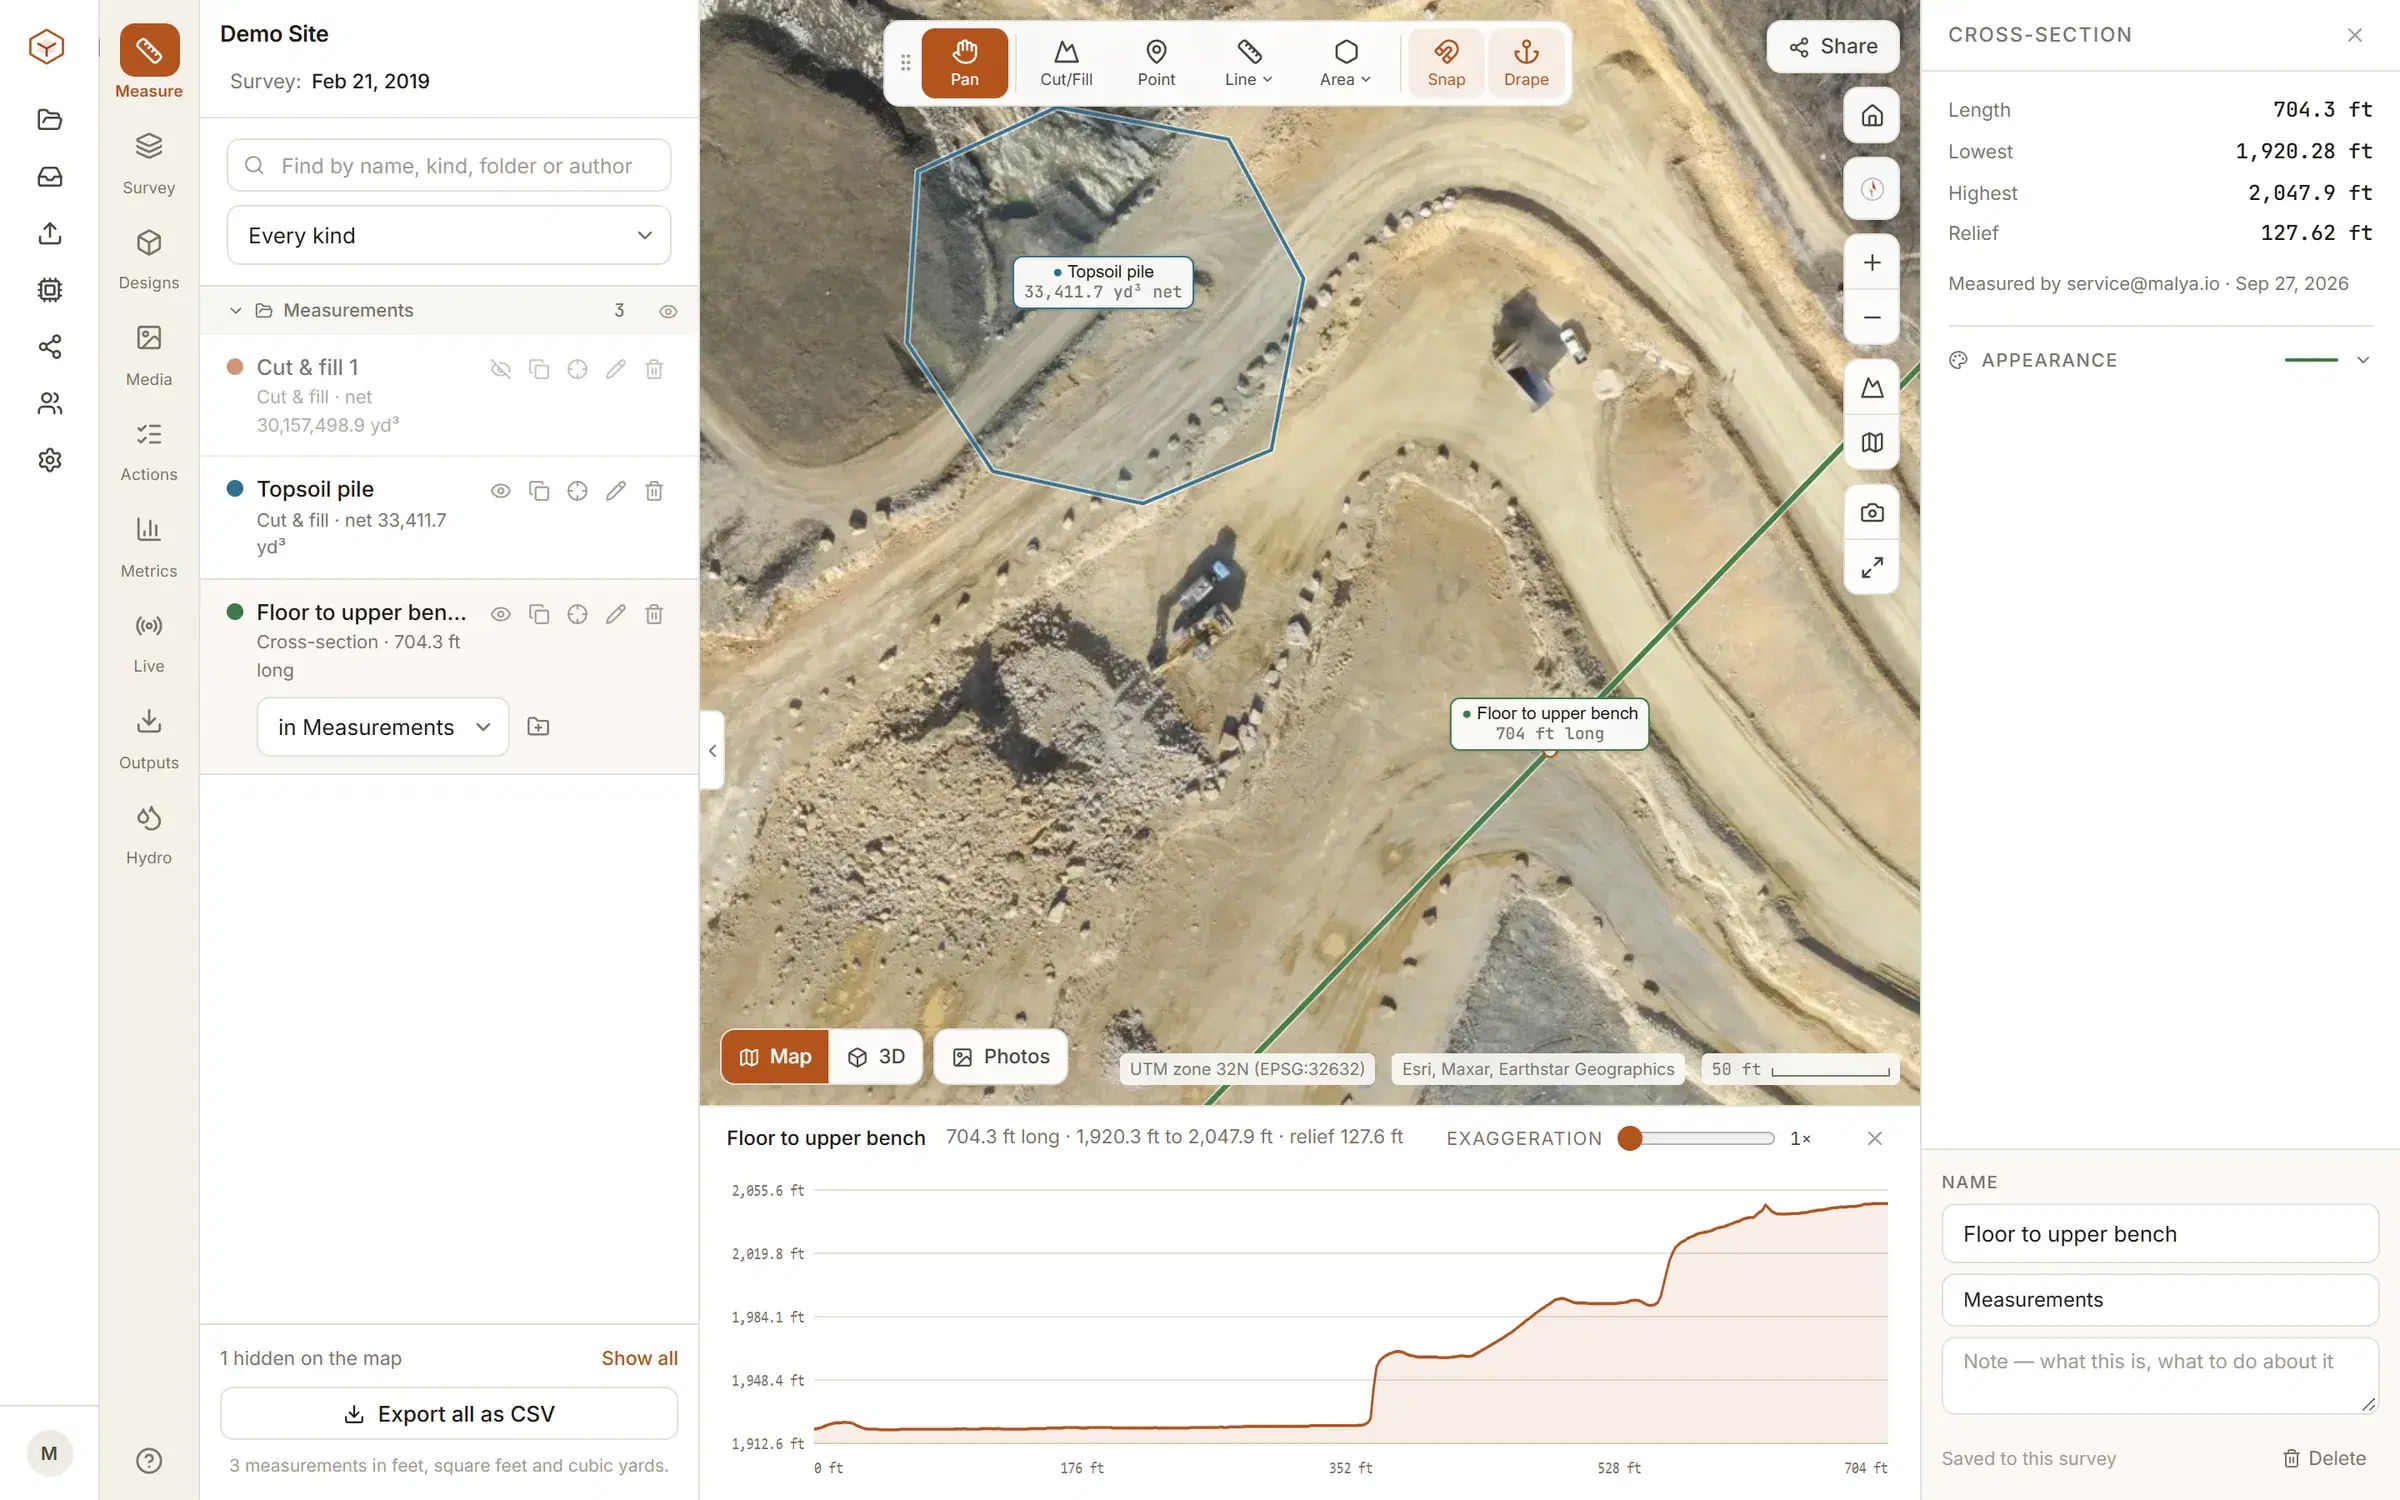
Cross-sections and profiles.
Draw a line anywhere and read the ground along it. Chainage, rise and fall, and the average grade, with the profile drawn under the map as you work.
The ground, three ways.
The same terrain model, read three different ways, each one a switch in the panel. The intervals, what the lines follow and what the DXF holds are set out under contours from a drone survey.
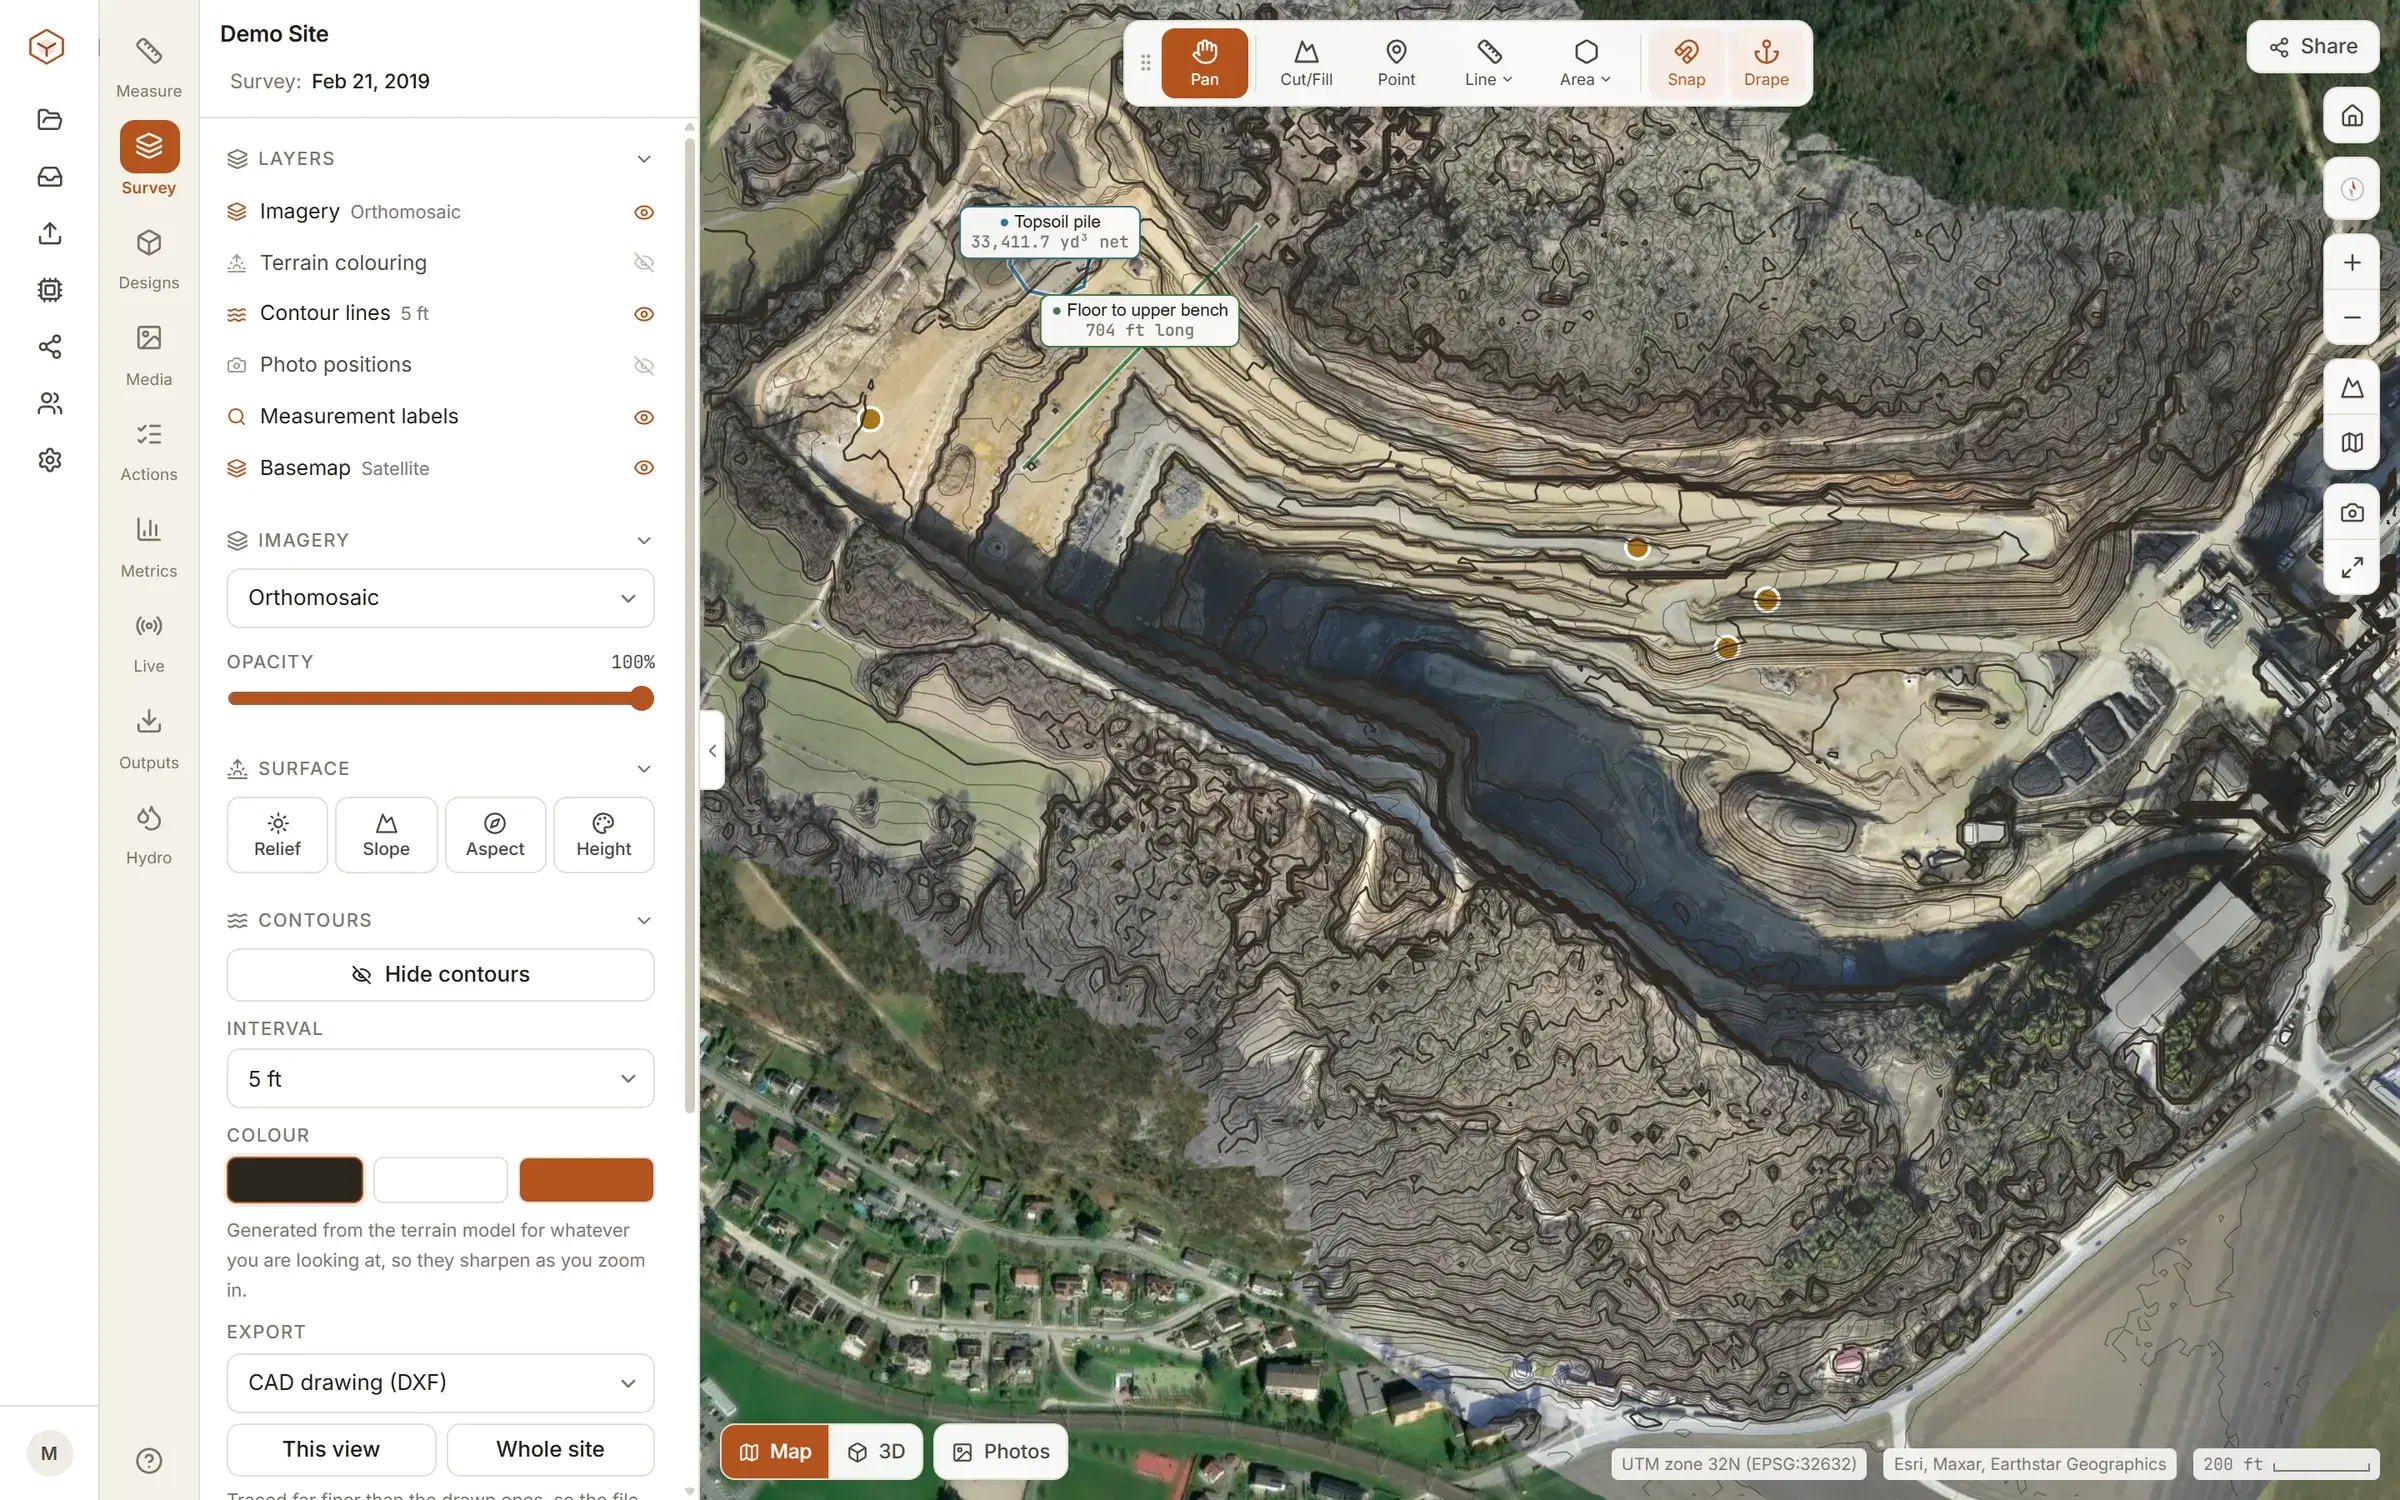
Contours
Generated at the interval you pick over the whole site or one boundary, and exported as real DXF polylines at their true elevation.
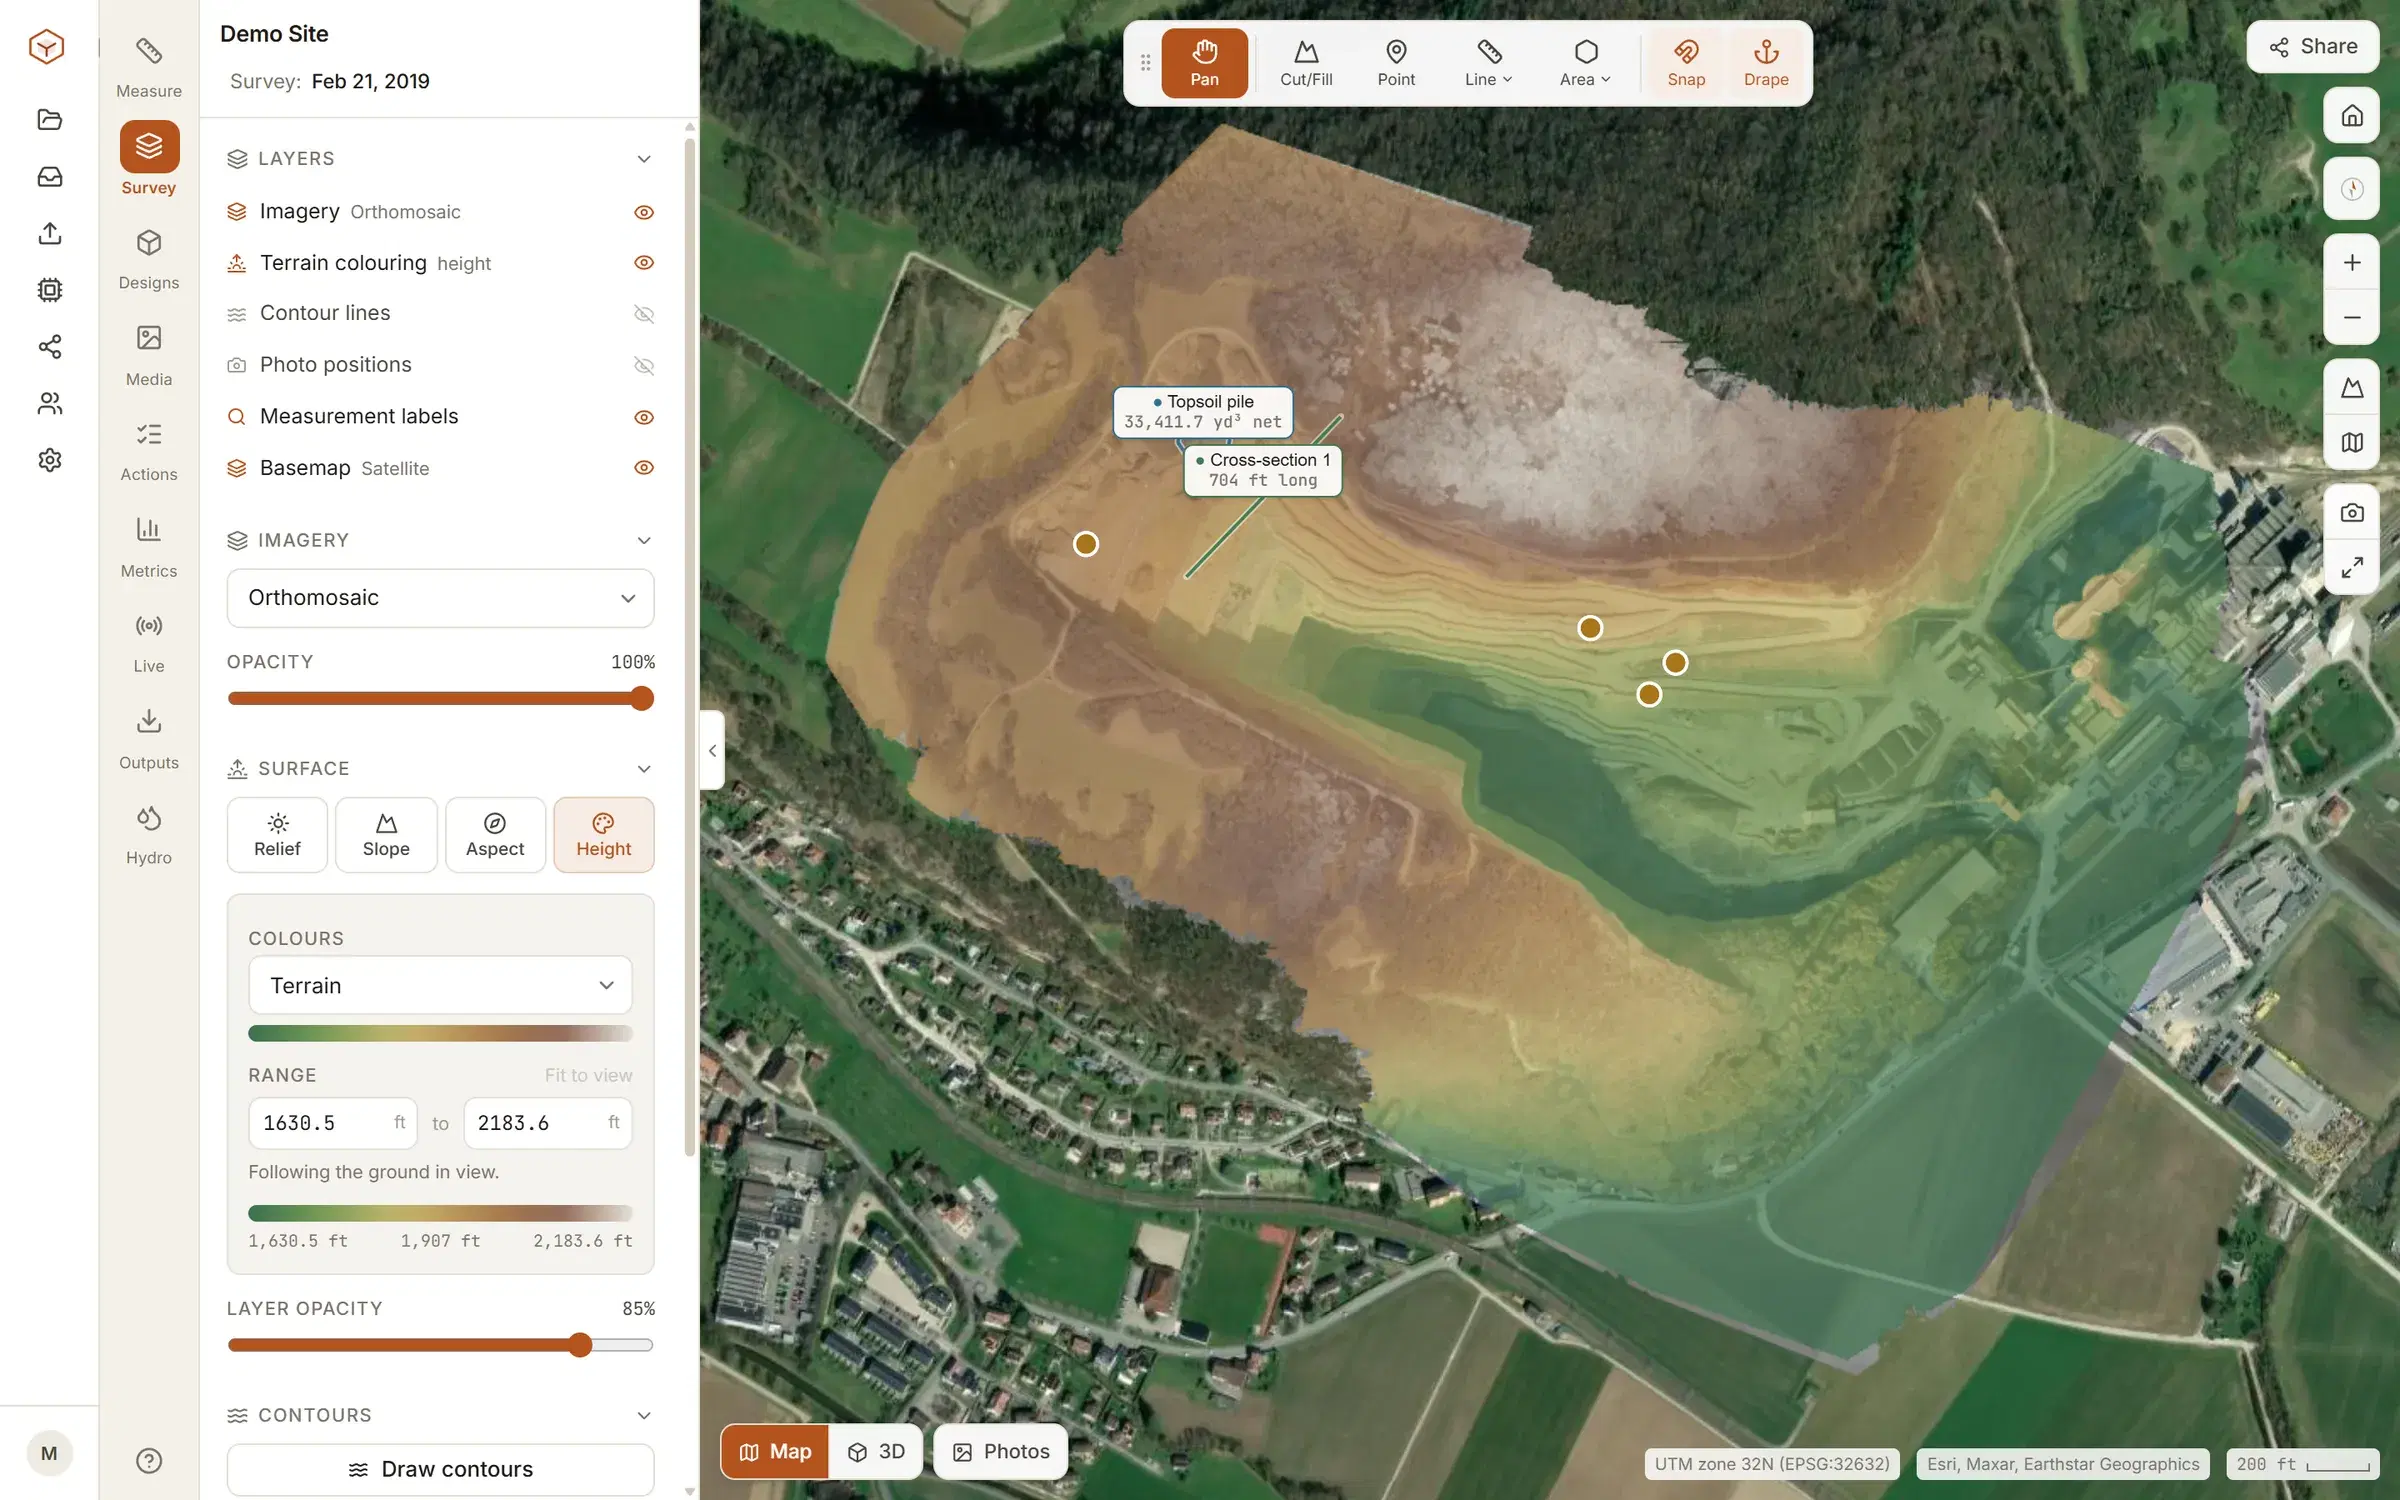
Terrain colouring
Relief, slope, aspect and height, drawn over the imagery with an opacity you set and a legend that means something.
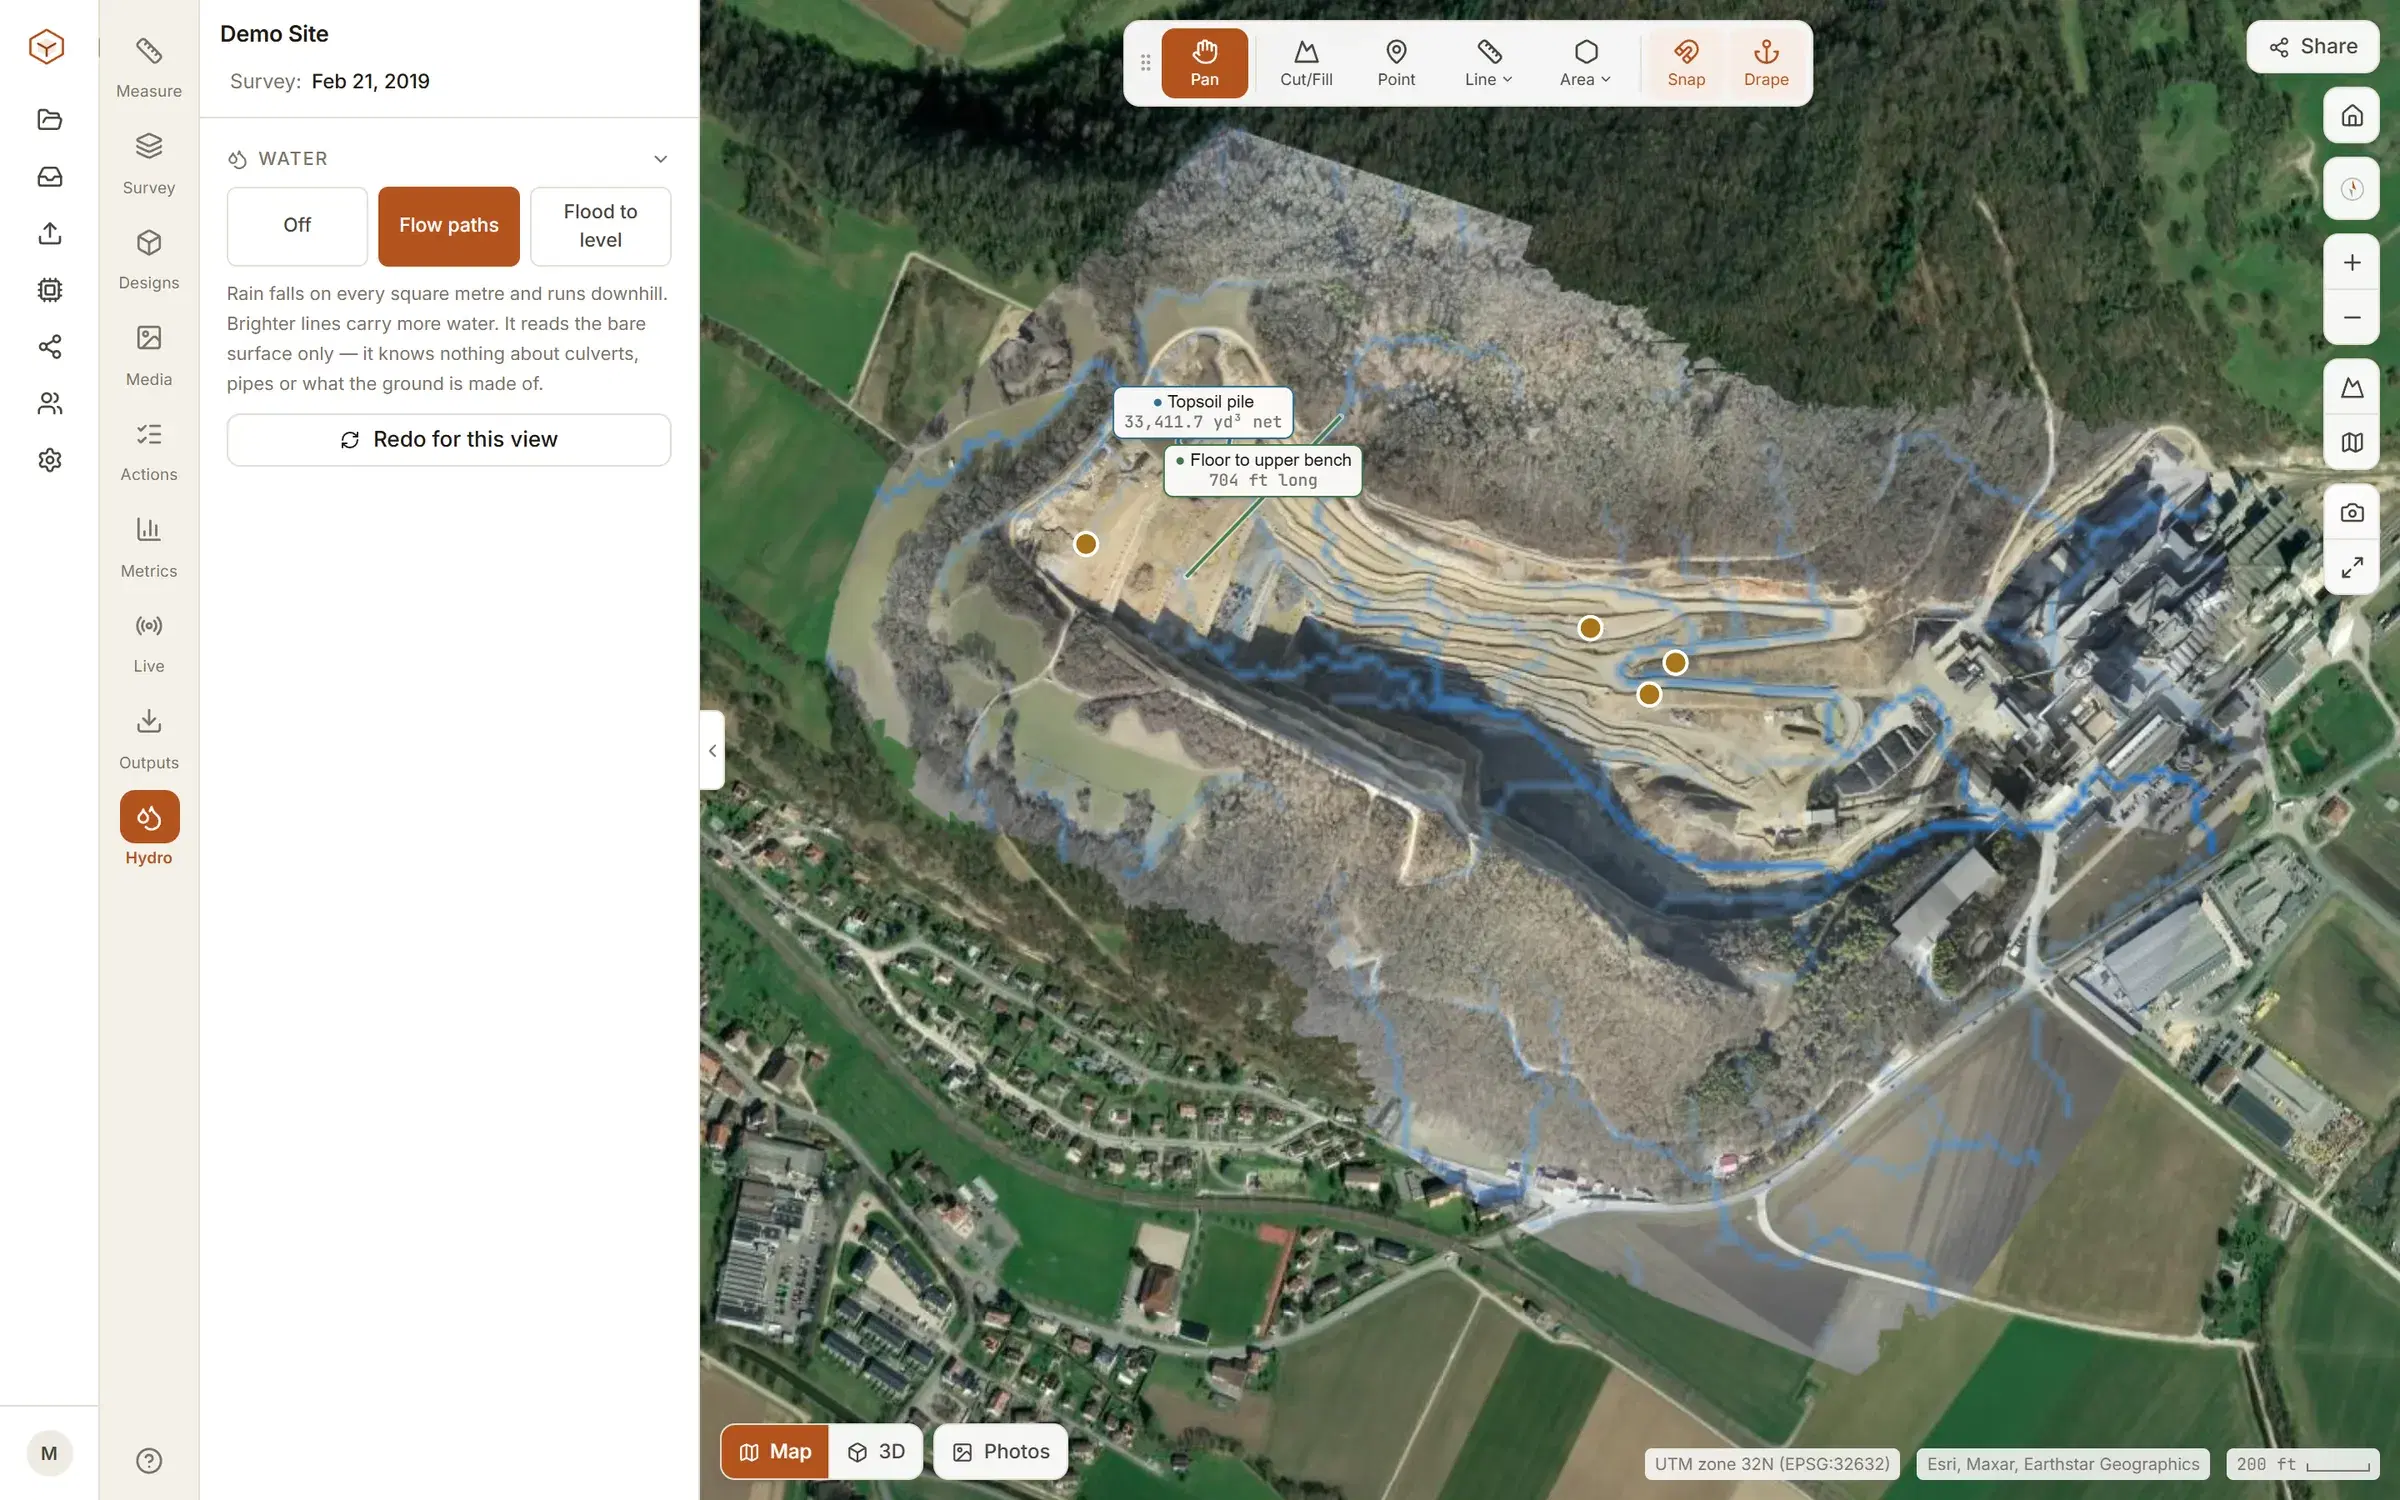
Water
Flow paths over the surface model, and a flood level you can raise and lower, for the drainage question that follows the volume question.
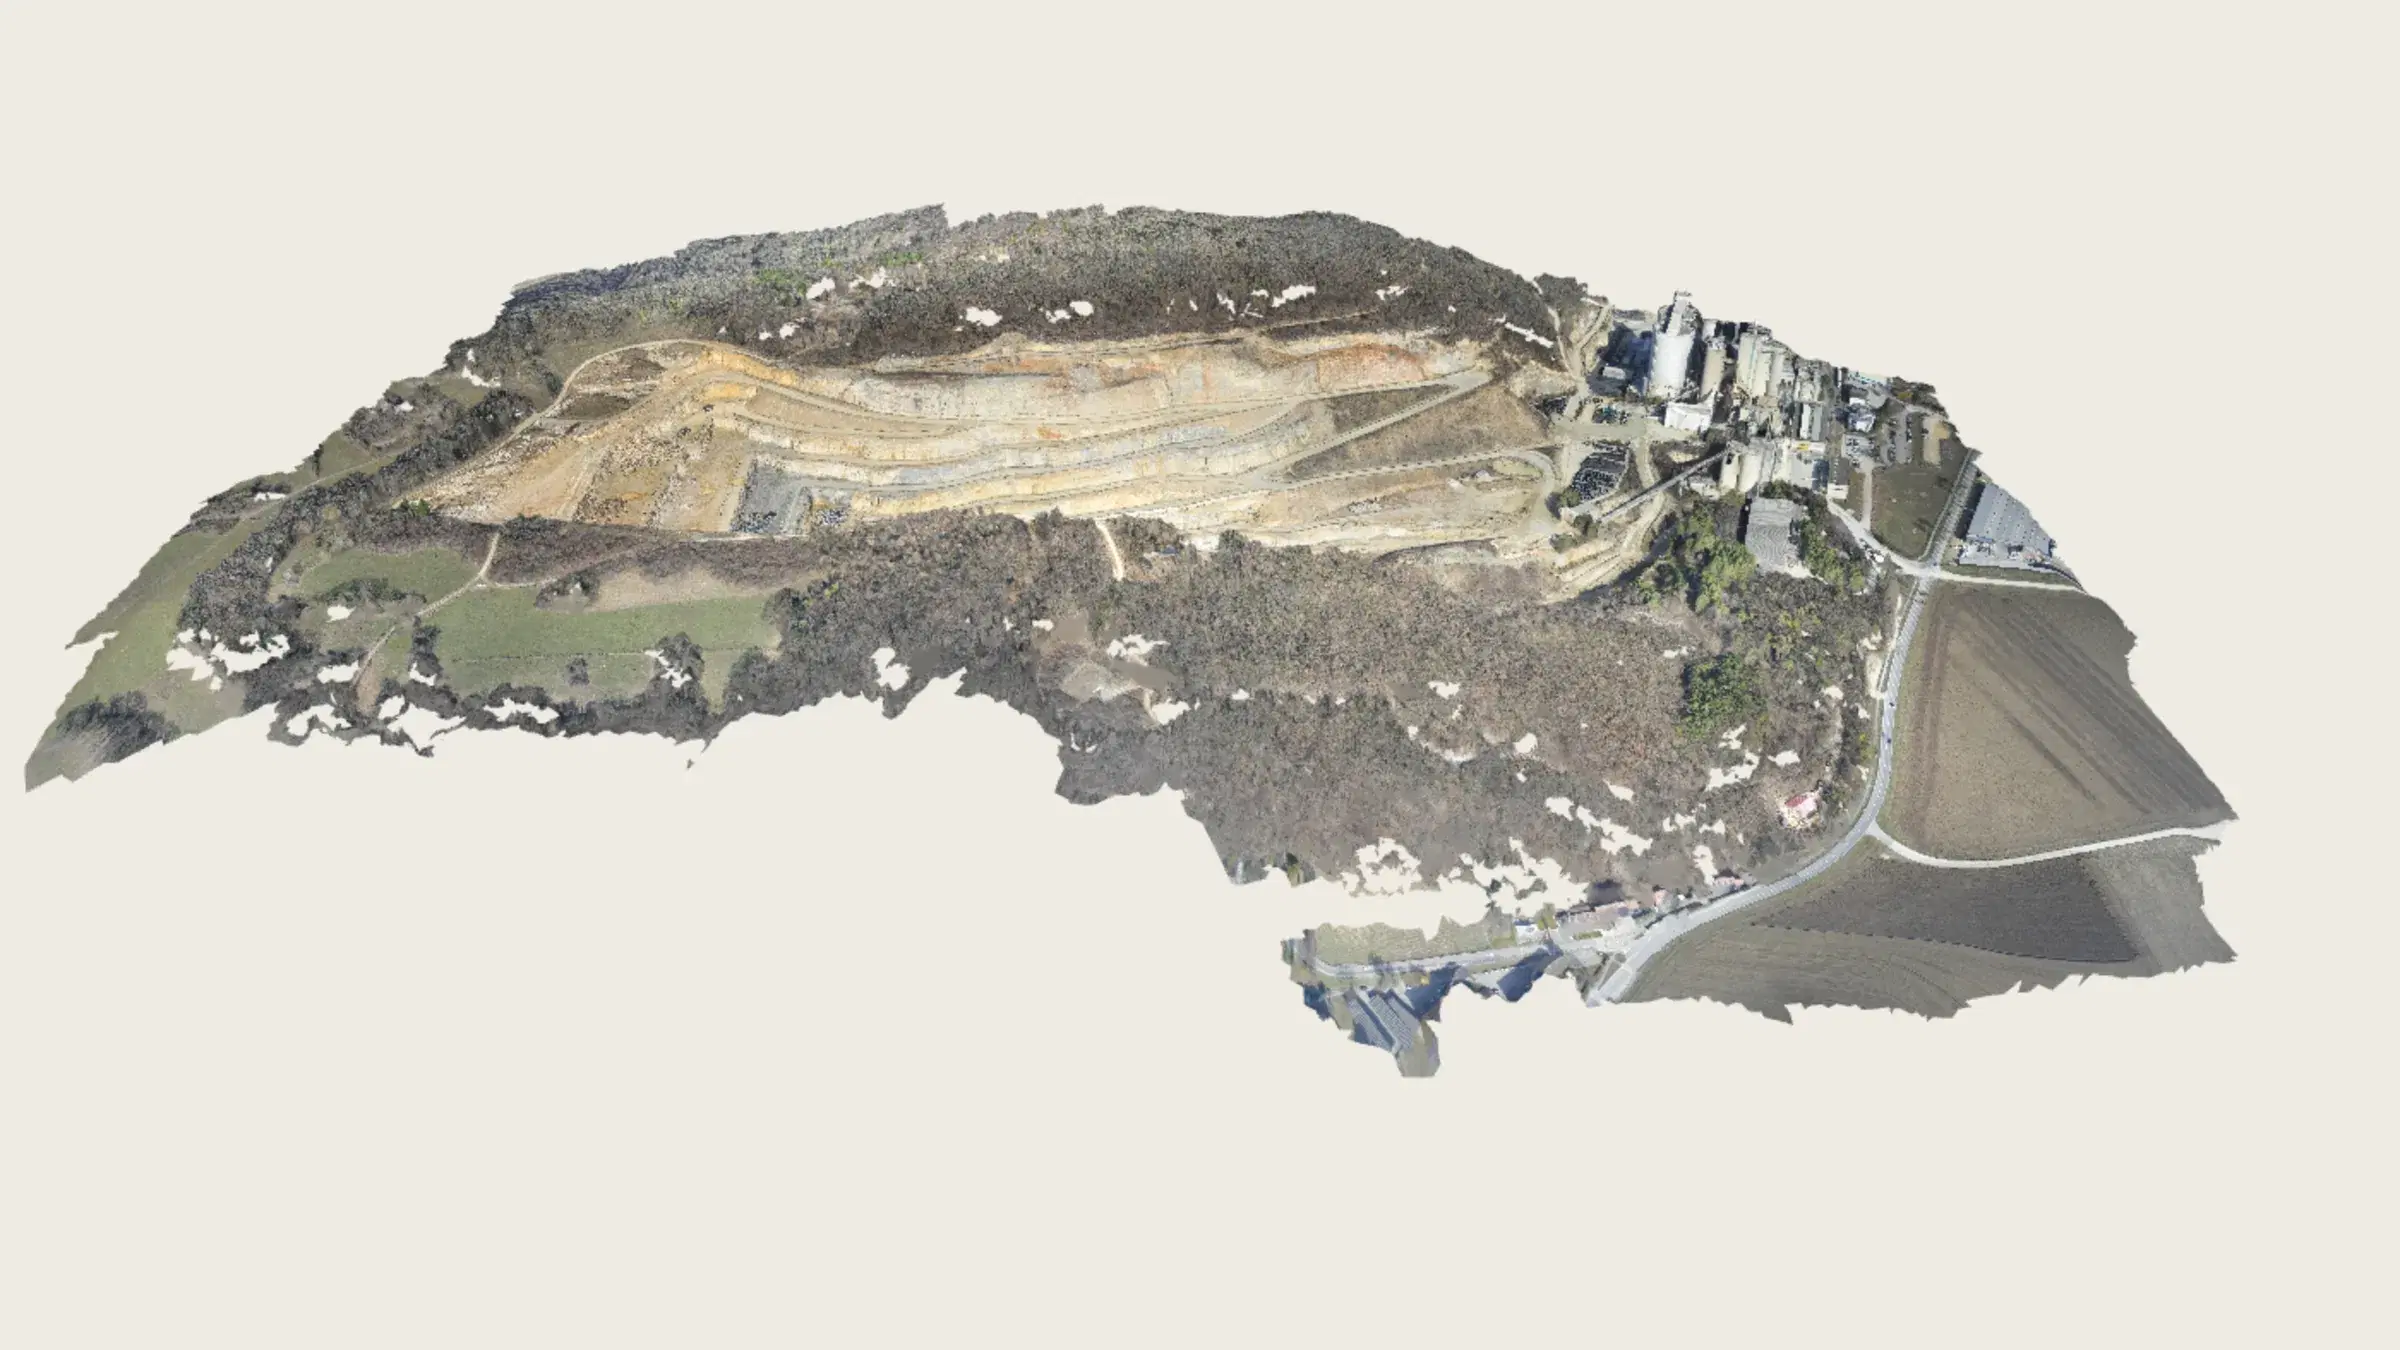
The site in 3D.
A textured mesh of the ground as it was flown, in the browser. Orbit it and look along a face. Measuring stays on the map.
The mesh comes out of the photogrammetry with the imagery, and it is a file you can download and open in your own software. See how a flight becomes a site, and every file you can take away from it.
And the ordinary ones.
The measurements a site asks for twenty times a day, snapped to the terrain rather than to the picture.
Points
A spot height with its latitude and longitude.
Distances
Horizontal and along the ground, with the climb and descent between the ends.
Areas
Flat area and the draped surface area, which are different things on a slope.
Grades
Two clicks for the rise, run and grade between them.
Berm checks
Crest height, toe-to-toe width and face slopes across a windrow, from one line.
Photo positions
Where every photo of the flight was taken, on the map.
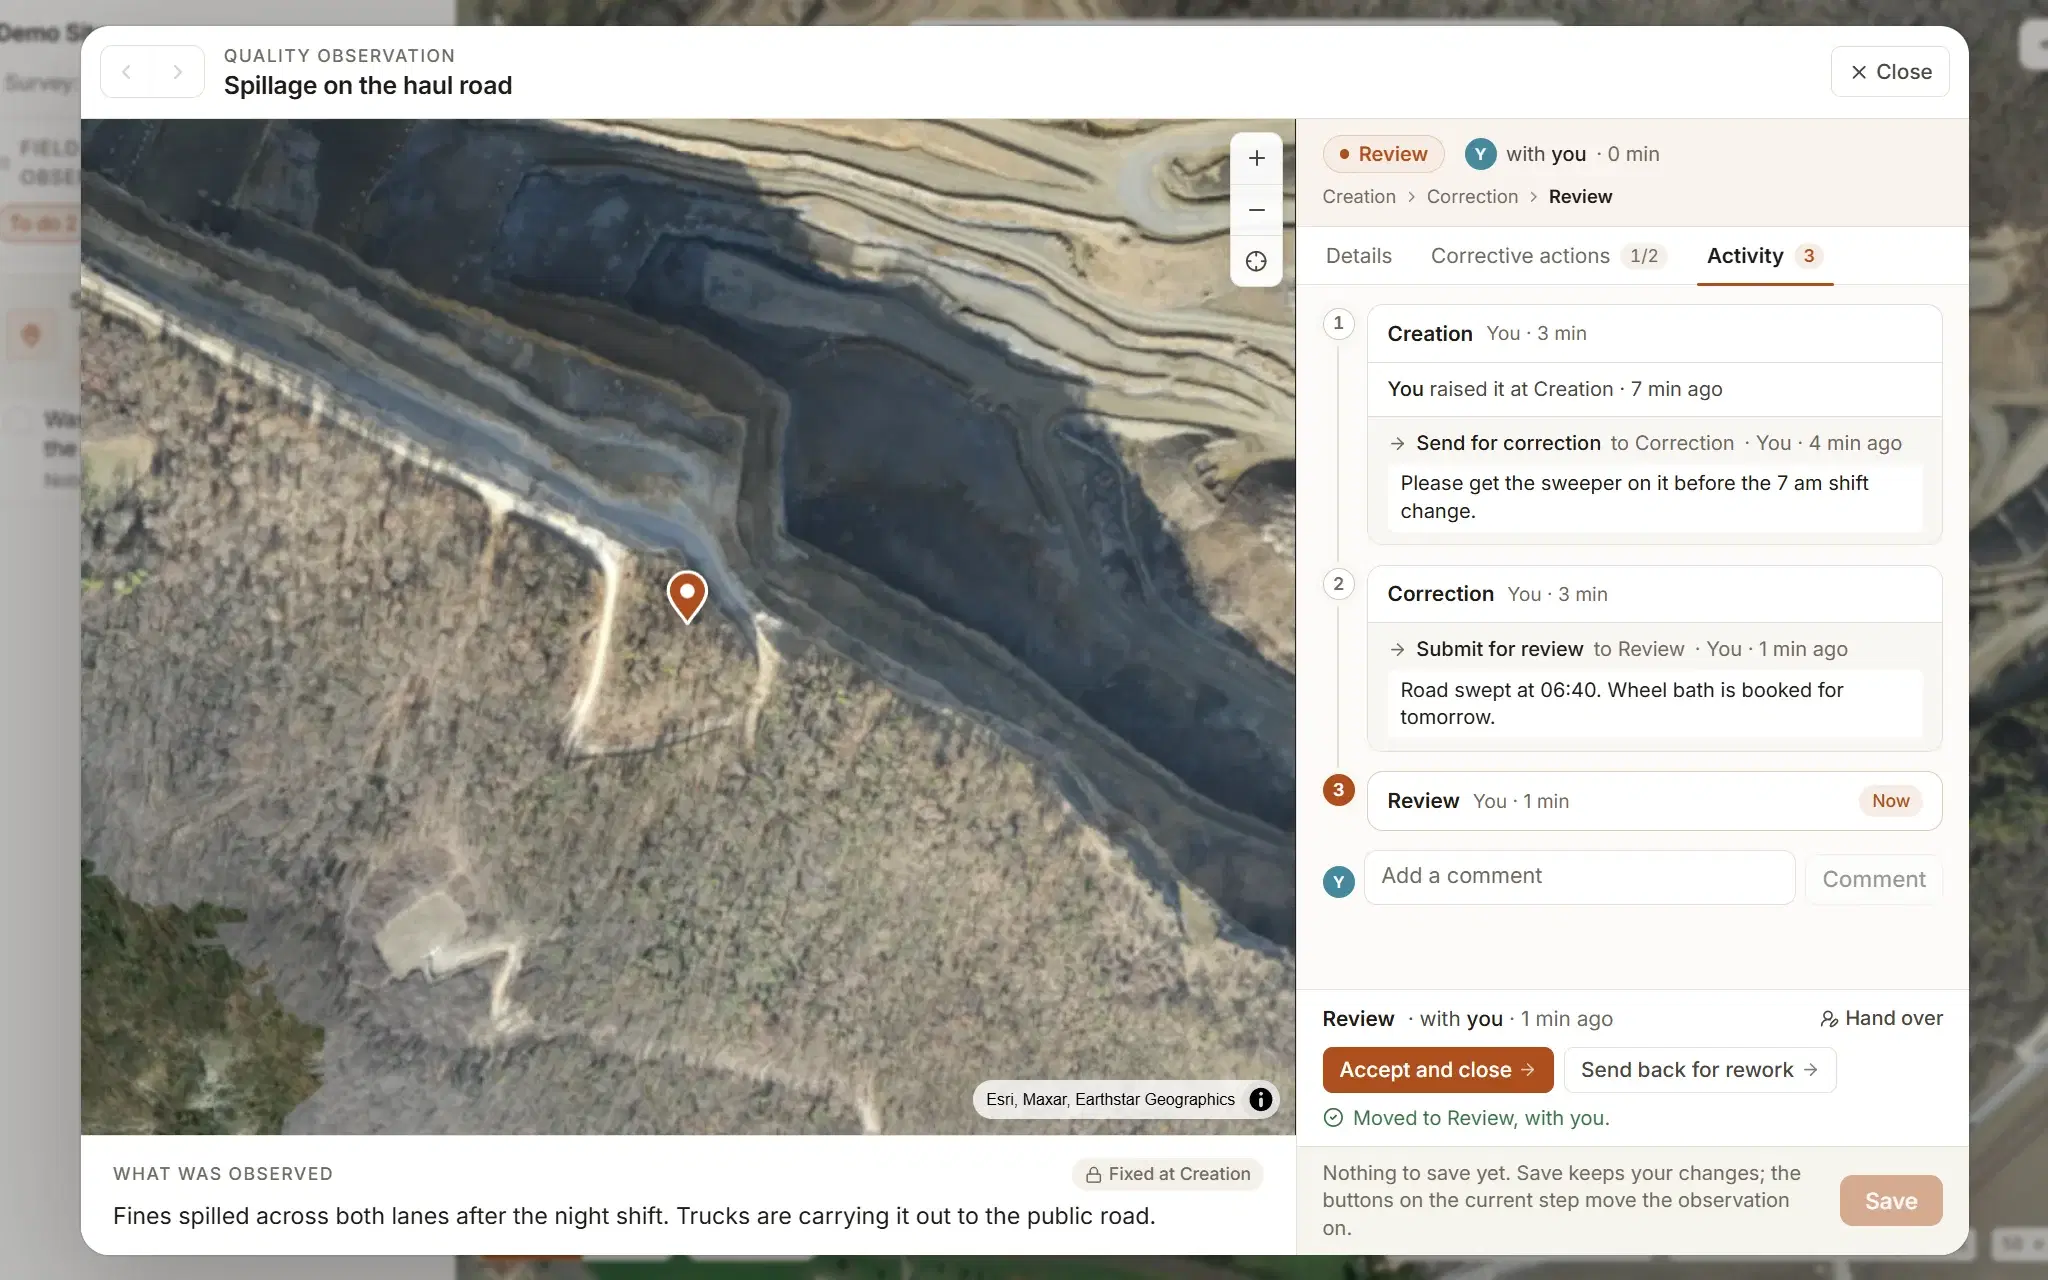
Every measuring tool works on the demo site, free.
Measure a real quarry, already flown, before you fly anything of your own. Your own ground, comparing flights, designs and exports start on Studio, at $50 a month: see what each plan includes.